Cleanroom Technologies Market: Global Industry Analysis and Forecast (2024-2030) by Product, Construction Type, End-Use, and Region
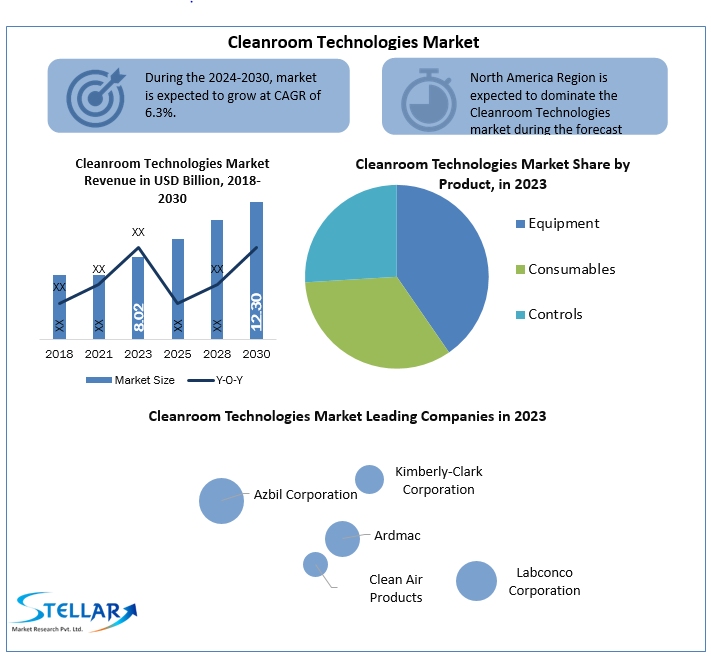
Cleanroom Technologies Market size was valued at US$ 8.02 Bn. in 2023 and the total revenue is expected to grow at a CAGR of 6.3% through 2024 to 2030, reaching nearly US$ 12.30 Bn.
Format : PDF | Report ID : SMR_300
Cleanroom Technologies Market Overview:
A cleanroom is an environment with minimal levels of environmental pollutants such as dust, airborne microorganisms, aerosol particles, and chemical vapours, which is generally employed in manufacturing or scientific research. In the semiconductor, pharmaceutical, and electronics sectors, contamination, particularly airborne contamination, is a major issue. A single human hair, for example, may wreak havoc on a $400 CPU. Contamination can only be removed by controlling the entire environment. Cleanroom technology does this by carefully managing air flow rates and direction, as well as pressurisation, temperature, and humidity levels. Though cleanroom technologies market forecasting through 2027 is based on real output, demand and supply of 2020, 2020 numbers are also estimated on real numbers published by key players as well all-important players across the world. Market forecasting till 2027 is done based on past data from 2016 to 2019 with the impact of global lock down on the market in 2020 and 2021.
To get more Insights: Request Free Sample Report
Cleanroom Technologies Market Dynamics:
The rising demand for high-quality, regulatory-compliant products, together with the technological and economic advantages of these technologies, is assisting businesses in achieving higher rankings. Moreover, advantages such as customized solutions, time and cost savings, as well as better product flow between cleanrooms are among the factors driving demand. Other factors expected to boost the cleanroom technologies market over the forecast period include technological advancements associated with these technologies, such as HEPA technology and the unidirectional airflow system, as well as the commercialization of these technologies and modular cleanroom technology.
The biotechnology sector is a major contribution to the global life science industry's growth. Several biologic compounds have emerged in the healthcare business. Besides, biological products are a major target of new medication development research. Over 200 biologics have been authorized by the US FDA in the last decade. A new class of medicines has emerged in the biopharmaceutical industry, with substantial potential for new therapies in oncology, diabetes, and other disease areas. Hundreds of monoclonal antibodies, vaccines, and biologics are currently in clinical trials. The demand for cleanrooms for drug manufacturing is increasing as new drugs are approved more quickly. Furthermore, because many biologics are pathogenic, aseptic conditions must be maintained during production. As a result, cleanrooms are an important part of the biologics manufacturing process.
By implementing cleanroom technology, a corporation may ensure that its products not only meet, but also exceed, industry standards. This improves product portfolios, which in turn improves a company's global cleanroom technologies market ranking. Cleanroom equipment not only aids in the production of technically superior products, but it also provides a cost advantage to businesses.
The use and upkeep of a cleanroom is a difficult task. Construction of typical cleanrooms for pharmaceutical and medical device manufacture might cost anywhere from $100 to more than $1,000 per square foot. In addition, the price per square foot for ISO 6 and ISO 8 cleanrooms differs. This is due to the fact that the volume of air delivered in both types of cleanrooms differs. In an ISO 6 cleanroom, the air is 100 times cleaner than in an ISO 8 cleanroom, increasing the air conditioning capacity of the HVAC systems.
Cleanroom Technologies Market Segment Analysis:
Based on the Product, the market is segmented into Equipment, Consumables, and Control. Consumables product segment is expected to hold the largest market shares of xx% by 2027. Compared to cleanroom equipment, frequent usage of consumables and strong sales of cleanroom consumables, namely gloves, is another crucial reason contributing to the segment's highest share. Cleanroom consumables are either reusable or disposable and are typically used in pharmaceutical, biotechnological, diagnostic, and hospital production facilities. Bulk purchases by manufacturing businesses, increased demand for preventing contamination by staff, convenience, and numerous alternatives created by the leading players are all contributing to the segment's growth. These are the factors that are expected to drives the growth of this segment in the Cleanroom Technologies market during the forecast period 2021-2027.
Based on the End-Use, the Cleanroom Technologies Market is segmented into Pharmaceutical industry, Medical device industry, Biotechnology industry, and Hospitals and diagnostic centers. Pharmaceutical industry segment is expected to grow rapidly at a CAGR of xx% during the forecast period 2021-2027. The increase is due to stricter laws governing the approval of pharmaceutical products, which has resulted in a higher need for cleanroom technology. Air with low particle matter is necessary for pharmaceutical manufacture. Cleanroom technology equipment, such as HVAC, air showers, and air diffusers, assures the greatest product quality with the least amount of waste, maximises yield, and streamlines the manufacturing process. The use of cleanroom technology in the pharmaceutical business has increased as a result of the above causes, indicating a strong growth potential.
Cleanroom Technologies Market Regional Insights:
North America region is expected to dominate the Cleanroom Technologies market during the forecast period 2021-2027. North America region is expected to hold the largest market shares of xx% by 2027. This is due to the region's well-established healthcare infrastructure, the presence of major pharmaceutical and medical device companies on the ground, an increase in the burden of non-communicable diseases, and a rise in cosmeceutical and nutraceutical awareness. Besides, strict laws governing the certification of healthcare items in this region, such as the United States, have resulted in an increase in cleanroom technology demand. These are the key major drivers that are expected to drives the growth of the North America region in the Cleanroom Technologies Market during the forecast period.
Asia Pacific cleanroom technologies market is expected to grow rapidly at a CAGR of xx% during the forecast period 2021-2027. The increase in generic drug production due to branded drug patent expirations, the growing geriatric population, and the rising burden of non-communicable diseases are the major factors driving the pharmaceutical industry's growth in Asia Pacific, resulting in the cleanroom technology market's growth.
The objective of the report is to present a comprehensive analysis of the Cleanroom Technologies Market to the stakeholders in the industry. The report provides trends that are most dominant in the Cleanroom Technologies Market and how these trends will influence new business investments and market development throughout the forecast period. The report also aids in the comprehension of the Cleanroom Technologies Market dynamics and competitive structure of the market by analyzing market leaders, market followers, and regional players.
The qualitative and quantitative data provided in the Cleanroom Technologies Market report is to help understand which market segments, regions are expected to grow at higher rates, factors affecting the market, and key opportunity areas, which will drive the industry and market growth through the forecast period. The report also includes the competitive landscape of key players in the industry along with their recent developments in the Cleanroom Technologies Market. The report studies factors such as company size, market share, market growth, revenue, production volume, and profits of the key players in the global market.
The report provides Porter's Five Force Model, which helps in designing the business strategies in the market. The report helps in identifying how many rivals are existing, who they are, and how their product quality is in the Market. The report also analyses if the Cleanroom Technologies Market is easy for a new player to gain a foothold in the market, do they enter or exit the market regularly if the market is dominated by a few players, etc.
The report also includes a PESTEL Analysis, which aids in the development of company strategies. Political variables help in figuring out how much a government can influence the Market. Economic variables aid in the analysis of economic performance drivers that have an impact on the Market. Understanding the impact of the surrounding environment and the influence of environmental concerns on the Cleanroom Technologies Market is aided by legal factors.
Cleanroom Technologies Market Scope:
|
Cleanroom Technologies Market Scope |
|
|
Market Size in 2023 |
USD 8.02 Bn. |
|
Market Size in 2030 |
USD 12.30 Bn. |
|
CAGR (2024-2030) |
6.3% |
|
Historic Data |
2018-2022 |
|
Base Year |
2023 |
|
Forecast Period |
2024-2030 |
|
Segment Scope |
By Product
|
|
By Construction Type
|
|
|
By End-Use
|
|
|
Regional Scope |
North America- United States, Canada, and Mexico Europe – UK, France, Germany, Italy, Spain, Sweden, Austria, and Rest of Europe Asia Pacific – China, India, Japan, South Korea, Australia, ASEAN, Rest of APAC Middle East and Africa - South Africa, GCC, Egypt, Nigeria, Rest of the Middle East and Africa South America – Brazil, Argentina, Rest of South America |
Cleanroom Technologies Market Key Players
- Azbil Corporation (Japan)
- Kimberly-Clark Corporation (US)
- Ardmac (Ireland)
- Clean Air Products (US)
- Labconco Corporation (US)
- Dynarex Corporation (US)
- DuPont de Nemours, Inc. (US)
- Illinois Tool Works, Inc. (US)
- Taikisha Ltd. (Japan)
- Exyte AG (Germany)
- COLANDIS GmbH (Germany)
- ABN Cleanroom Technology (Belgium)
- Clean Rooms International, Inc. (US)
- Bouygues Group (France)
- Terra Universal, Inc. (US)
- Connect 2 Cleanrooms Ltd. (UK)
Frequently Asked Questions
North America is expected to hold the highest share in the Cleanroom Technologies Market.
Azbil Corporation (Japan), Kimberly-Clark Corporation (US), Ardmac (Ireland), Clean Air Products (US), Labconco Corporation (US), and Dynarex Corporation (US) are the top key players in the Cleanroom Technologies Market.
Consumables product segment hold the largest market share in the Cleanroom Technologies market by 2030.
The market size of the Cleanroom Technologies market is expected to reach US $ 12.30 Bn. by 2030.
The market size of the Cleanroom Technologies market was worth US $ 8.02 Bn. in 2023.
Chapter 1 Scope of the Report
Chapter 2 Research Methodology
2.1. Research Process
2.2. Global Cleanroom Technologies Market: Target Audience
2.3. Global Cleanroom Technologies Market: Primary Research (As per Client Requirement)
2.4. Global Cleanroom Technologies Market: Secondary Research
Chapter 3 Executive Summary
Chapter 4 Competitive Landscape
4.1. Market Share Analysis, By Value, 2023-2030
4.1.1. Market Share Analysis, By Region, By Value, 2023-2030 (In %)
4.1.1.1. North America Market Share Analysis, By Value, 2023-2030 (In %)
4.1.1.2. Europe Market Share Analysis, By Value, 2023-2030 (In %)
4.1.1.3. Asia Pacific Market Share Analysis, By Value, 2023-2030 (In %)
4.1.1.4. South America Market Share Analysis, By Value, 2023-2030 (In %)
4.1.1.5. Middle East and Africa Market Share Analysis, By Value, 2023-2030 (In %)
4.1.2. Market Share Analysis, By Product, By Value, 2023-2030 (In %)
4.1.2.1. North America Market Share Analysis, By Product, By Value, 2023-2030 (In %)
4.1.2.1.1. USA Market Share Analysis, By Product, By Value, 2023-2030 (In %)
4.1.2.1.2. Canada Market Share Analysis, By Product, By Value, 2023-2030 (In %)
4.1.2.1.3. Mexico Market Share Analysis, By Product, By Value, 2023-2030 (In %)
4.1.2.2. Europe Market Share Analysis, By Product, By Value, 2023-2030 (In %)
4.1.2.2.1. UK Market Share Analysis, By Product, By Value, 2023-2030 (In %)
4.1.2.2.2. France Market Share Analysis, By Product, By Value, 2023-2030 (In %)
4.1.2.2.3. Germany Market Share Analysis, By Product, By Value, 2023-2030 (In %)
4.1.2.2.4. Italy Market Share Analysis, By Product, By Value, 2023-2030 (In %)
4.1.2.2.5. Spain Market Share Analysis, By Product, By Value, 2023-2030 (In %)
4.1.2.2.6. Sweden Market Share Analysis, By Product, By Value, 2023-2030 (In %)
4.1.2.2.7. Austria Market Share Analysis, By Product, By Value, 2023-2030 (In %)
4.1.2.2.8. Rest of Europe Market Share Analysis, By Product, By Value, 2023-2030 (In %)
4.1.2.3. Asia Pacific Market Share Analysis, By Product, By Value, 2023-2030 (In %)
4.1.2.3.1. China Market Share Analysis, By Product, By Value, 2023-2030 (In %)
4.1.2.3.2. India Market Share Analysis, By Product, By Value, 2023-2030 (In %)
4.1.2.3.3. Japan Market Share Analysis, By Product, By Value, 2023-2030 (In %)
4.1.2.3.4. South Korea Market Share Analysis, By Product, By Value, 2023-2030 (In %)
4.1.2.3.5. Australia Market Share Analysis, By Product, By Value, 2023-2030 (In %)
4.1.2.3.6. ASEAN Market Share Analysis, By Product, By Value, 2023-2030 (In %)
4.1.2.3.7. Rest of APAC Market Share Analysis, By Product, By Value, 2023-2030 (In %)
4.1.2.4. South America Market Share Analysis, By Product, By Value, 2023-2030 (In %)
4.1.2.4.1. Brazil Market Share Analysis, By Product, By Value, 2023-2030 (In %)
4.1.2.4.2. Argentina Market Share Analysis, By Product, By Value, 2023-2030 (In %)
4.1.2.4.3. Rest of South America Market Share Analysis, By Product, By Value, 2023-2030 (In %)
4.1.2.5. Middle East and Africa Market Share Analysis, By Product, By Value, 2023-2030 (In %)
4.1.2.5.1. South Africa Market Share Analysis, By Product, By Value, 2023-2030 (In %)
4.1.2.5.2. GCC Market Share Analysis, By Product, By Value, 2023-2030 (In %)
4.1.2.5.3. Egypt Market Share Analysis, By Product, By Value, 2023-2030 (In %)
4.1.2.5.4. Nigeria Market Share Analysis, By Product, By Value, 2023-2030 (In %)
4.1.2.5.5. Rest of Middle East and Africa Market Share Analysis, By Product, By Value, 2023-2030 (In %)
4.1.3. Market Share Analysis, By Construction Type, By Value, 2023-2030 (In %)
4.1.3.1. North America Market Share Analysis, By Construction Type, By Value, 2023-2030 (In %)
4.1.3.1.1. USA Market Share Analysis, By Construction Type, By Value, 2023-2030 (In %)
4.1.3.1.2. Canada Market Share Analysis, By Construction Type, By Value, 2023-2030 (In %)
4.1.3.1.3. Mexico Market Share Analysis, By Construction Type, By Value, 2023-2030 (In %)
4.1.3.2. Europe Market Share Analysis, By Construction Type, By Value, 2023-2030 (In %)
4.1.3.2.1. UK Market Share Analysis, By Construction Type, By Value, 2023-2030 (In %)
4.1.3.2.2. France Market Share Analysis, By Construction Type, By Value, 2023-2030 (In %)
4.1.3.2.3. Germany Market Share Analysis, By Construction Type, By Value, 2023-2030 (In %)
4.1.3.2.4. Italy Market Share Analysis, By Construction Type, By Value, 2023-2030 (In %)
4.1.3.2.5. Spain Market Share Analysis, By Construction Type, By Value, 2023-2030 (In %)
4.1.3.2.6. Sweden Market Share Analysis, By Construction Type, By Value, 2023-2030 (In %)
4.1.3.2.7. Austria Market Share Analysis, By Construction Type, By Value, 2023-2030 (In %)
4.1.3.2.8. Rest of Europe Market Share Analysis, By Construction Type, By Value, 2023-2030 (In %)
4.1.3.3. Asia Pacific Market Share Analysis, By Construction Type, By Value, 2023-2030 (In %)
4.1.3.3.1. China Market Share Analysis, By Construction Type, By Value, 2023-2030 (In %)
4.1.3.3.2. India Market Share Analysis, By Construction Type, By Value, 2023-2030 (In %)
4.1.3.3.3. Japan Market Share Analysis, By Construction Type, By Value, 2023-2030 (In %)
4.1.3.3.4. South Korea Market Share Analysis, By Construction Type, By Value, 2023-2030 (In %)
4.1.3.3.5. Australia Market Share Analysis, By Construction Type, By Value, 2023-2030 (In %)
4.1.3.3.6. ASEAN Market Share Analysis, By Construction Type, By Value, 2023-2030 (In %)
4.1.3.3.7. Rest of APAC Market Share Analysis, By Construction Type, By Value, 2023-2030 (In %)
4.1.3.4. South America Market Share Analysis, By Construction Type, By Value, 2023-2030 (In %)
4.1.3.4.1. Brazil Market Share Analysis, By Construction Type, By Value, 2023-2030 (In %)
4.1.3.4.2. Argentina Market Share Analysis, By Construction Type, By Value, 2023-2030 (In %)
4.1.3.4.3. Rest of South America Market Share Analysis, By Construction Type, By Value, 2023-2030 (In %)
4.1.3.5. Middle East and Africa Market Share Analysis, By Construction Type, By Value, 2023-2030 (In %)
4.1.3.5.1. South Africa Market Share Analysis, By Construction Type, By Value, 2023-2030 (In %)
4.1.3.5.2. GCC Market Share Analysis, By Construction Type, By Value, 2023-2030 (In %)
4.1.3.5.3. Egypt Market Share Analysis, By Construction Type, By Value, 2023-2030 (In %)
4.1.3.5.4. Nigeria Market Share Analysis, By Construction Type, By Value, 2023-2030 (In %)
4.1.3.5.5. Rest of Middle East and Africa Market Share Analysis, By Construction Type, By Value, 2023-2030 (In %)
4.1.4. Market Share Analysis, By End-Use, By Value, 2023-2030 (In %)
4.1.4.1. North America Market Share Analysis, By End-Use, By Value, 2023-2030 (In %)
4.1.4.1.1. USA Market Share Analysis, By End-Use, By Value, 2023-2030 (In %)
4.1.4.1.2. Canada Market Share Analysis, By End-Use, By Value, 2023-2030 (In %)
4.1.4.1.3. Mexico Market Share Analysis, By End-Use, By Value, 2023-2030 (In %)
4.1.4.2. Europe Market Share Analysis, By End-Use, By Value, 2023-2030 (In %)
4.1.4.2.1. UK Market Share Analysis, By End-Use, By Value, 2023-2030 (In %)
4.1.4.2.2. France Market Share Analysis, By End-Use, By Value, 2023-2030 (In %)
4.1.4.2.3. Germany Market Share Analysis, By End-Use, By Value, 2023-2030 (In %)
4.1.4.2.4. Italy Market Share Analysis, By End-Use, By Value, 2023-2030 (In %)
4.1.4.2.5. Spain Market Share Analysis, By End-Use, By Value, 2023-2030 (In %)
4.1.4.2.6. Sweden Market Share Analysis, By End-Use, By Value, 2023-2030 (In %)
4.1.4.2.7. Austria Market Share Analysis, By End-Use, By Value, 2023-2030 (In %)
4.1.4.2.8. Rest of Europe Market Share Analysis, By End-Use, By Value, 2023-2030 (In %)
4.1.4.3. Asia Pacific Market Share Analysis, By End-Use, By Value, 2023-2030 (In %)
4.1.4.3.1. China Market Share Analysis, By End-Use, By Value, 2023-2030 (In %)
4.1.4.3.2. India Market Share Analysis, By End-Use, By Value, 2023-2030 (In %)
4.1.4.3.3. Japan Market Share Analysis, By End-Use, By Value, 2023-2030 (In %)
4.1.4.3.4. South Korea Market Share Analysis, By End-Use, By Value, 2023-2030 (In %)
4.1.4.3.5. Australia Market Share Analysis, By End-Use, By Value, 2023-2030 (In %)
4.1.4.3.6. ASEAN Market Share Analysis, By End-Use, By Value, 2023-2030 (In %)
4.1.4.3.7. Rest of APAC Market Share Analysis, By End-Use, By Value, 2023-2030 (In %)
4.1.4.4. South America Market Share Analysis, By End-Use, By Value, 2023-2030 (In %)
4.1.4.4.1. Brazil Market Share Analysis, By End-Use, By Value, 2023-2030 (In %)
4.1.4.4.2. Argentina Market Share Analysis, By End-Use, By Value, 2023-2030 (In %)
4.1.4.4.3. Rest of South America Market Share Analysis, By End-Use, By Value, 2023-2030 (In %)
4.1.4.5. Middle East and Africa Market Share Analysis, By End-Use, By Value, 2023-2030 (In %)
4.1.4.5.1. South Africa Market Share Analysis, By End-Use, By Value, 2023-2030 (In %)
4.1.4.5.2. GCC Market Share Analysis, By End-Use, By Value, 2023-2030 (In %)
4.1.4.5.3. Egypt Market Share Analysis, By End-Use, By Value, 2023-2030 (In %)
4.1.4.5.4. Nigeria Market Share Analysis, By End-Use, By Value, 2023-2030 (In %)
4.1.4.5.5. Rest of Middle East and Africa Market Share Analysis, By End-Use, By Value, 2023-2030 (In %)
4.2. Stellar Competition matrix
4.2.1. Global Stellar Competition Matrix
4.2.2. North America Stellar Competition Matrix
4.2.3. Europe Stellar Competition Matrix
4.2.4. Asia Pacific Stellar Competition Matrix
4.2.5. South America Stellar Competition Matrix
4.2.6. Middle East and Africa Stellar Competition Matrix
4.3. Key Players Benchmarking
4.3.1. Key Players Benchmarking By Product, Pricing, Market Share, Investments, Expansion Plans, Physical Presence and Presence in the Market.
4.4. Mergers and Acquisitions in Industry
4.4.1. M&A by Region, Value and Strategic Intent
4.5. Market Dynamics
4.5.1. Market Drivers
4.5.2. Market Restraints
4.5.3. Market Opportunities
4.5.4. Market Challenges
4.5.5. PESTLE Analysis
4.5.6. PORTERS Five Force Analysis
4.5.7. Value Chain Analysis
Chapter 5 Global Cleanroom Technologies Market Segmentation: By Product
5.1. Global Cleanroom Technologies Market, By Product, Overview/Analysis, 2023-2030
5.2. Global Cleanroom Technologies Market, By Product, By Value, Market Share (%), 2023-2030 (USD Million)
5.3. Global Cleanroom Technologies Market, By Product, By Value, -
5.3.1. Equipment
5.3.2. Consumables
5.3.3. Controls
Chapter 6 Global Cleanroom Technologies Market Segmentation: By Construction Type
6.1. Global Cleanroom Technologies Market, By Construction Type, Overview/Analysis, 2023-2030
6.2. Global Cleanroom Technologies Market Size, By Construction Type, By Value, Market Share (%), 2023-2030 (USD Million)
6.3. Global Cleanroom Technologies Market, By Construction Type, By Value, -
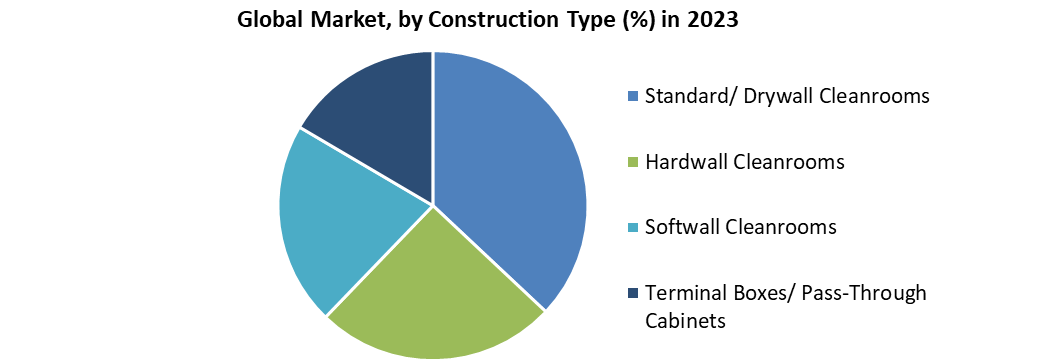
6.3.1. Standard/ Drywall Cleanrooms
6.3.2. Hardwall Cleanrooms
6.3.3. Softwall Cleanrooms
6.3.4. Terminal Boxes/ Pass-Through Cabinets
Chapter 7 Global Cleanroom Technologies Market Segmentation: By End-Use
7.1. Global Cleanroom Technologies Market, By End-Use, Overview/Analysis, 2023-2030
7.2. Global Cleanroom Technologies Market Size, By End-Use, By Value, Market Share (%), 2023-2030 (USD Million)
7.3. Global Cleanroom Technologies Market, By End-Use, By Value, -
7.3.1. Pharmaceutical industry
7.3.2. Medical device industry
7.3.3. Biotechnology industry
7.3.4. Hospitals and diagnostic centers
Chapter 8 Global Cleanroom Technologies Market Segmentation: By Region
8.1. Global Cleanroom Technologies Market, By Region – North America
8.1.1. North America Cleanroom Technologies Market Size, By Product, By Value, 2023-2030 (USD Million)
8.1.2. North America Cleanroom Technologies Market Size, By Construction Type, By Value, 2023-2030 (USD Million)
8.1.3. North America Cleanroom Technologies Market Size, By End-Use, By Value, 2023-2030 (USD Million)
8.1.4. By Country – U.S.
8.1.4.1. U.S. Cleanroom Technologies Market Size, By Product, By Value, 2023-2030 (USD Million)
8.1.4.2. U.S. Cleanroom Technologies Market Size, By Construction Type, By Value, 2023-2030 (USD Million)
8.1.4.3. U.S. Cleanroom Technologies Market Size, By End-Use, By Value, 2023-2030 (USD Million)
8.1.4.4. Canada Cleanroom Technologies Market Size, By Value, 2023-2030 (USD Million)
8.1.4.5. Mexico Cleanroom Technologies Market Size, By Value, 2023-2030 (USD Million)
8.2. Europe Cleanroom Technologies Market Size, By Value, 2023-2030 (USD Million)
8.2.1. UK
8.2.2. France
8.2.3. Germany
8.2.4. Italy
8.2.5. Spain
8.2.6. Sweden
8.2.7. Austria
8.2.8. Rest of Europe
8.3. Asia Pacific Cleanroom Technologies Market Size, By Value, 2023-2030 (USD Million)
8.3.1. China
8.3.2. India
8.3.3. Japan
8.3.4. South Korea
8.3.5. Australia
8.3.6. ASEAN
8.3.7. Rest of APAC
8.4. Middle East and Africa Cleanroom Technologies Market Size, By Value, 2023-2030 (USD Million)
8.4.1. South Africa
8.4.2. GCC
8.4.3. Egypt
8.4.4. Nigeria
8.4.5. Rest of Middle East and Africa
8.5. South America Cleanroom Technologies Market Size, By Value, 2023-2030 (USD Million)
8.5.1. Brazil
8.5.2. Argentina
8.5.3. Rest of South America
Chapter 9 Company Profiles
9.1. Key Players
9.1.1. Azbil Corporation (Japan)
9.1.1.1. Company Overview
9.1.1.2. Tube Portfolio
9.1.1.3. Financial Overview
9.1.1.4. Business Strategy
9.1.1.5. Key Developments
9.1.2. Kimberly-Clark Corporation (US)
9.1.3. Ardmac (Ireland)
9.1.4. Clean Air Products (US)
9.1.5. Labconco Corporation (US)
9.1.6. Dynarex Corporation (US)
9.1.7. DuPont de Nemours, Inc. (US)
9.1.8. Illinois Tool Works, Inc. (US)
9.1.9. Taikisha Ltd. (Japan)
9.1.10. Exyte AG (Germany)
9.1.11. COLANDIS GmbH (Germany)
9.1.12. ABN Cleanroom Technology (Belgium)
9.1.13. Clean Rooms International, Inc. (US)
9.1.14. Bouygues Group (France)
9.1.15. Terra Universal, Inc. (US)
9.1.16. Connect 2 Cleanrooms Ltd. (UK)
9.2. Key Findings
9.3. Recommendations


