Coffee Market: Global Industry Analysis and Forecast (2024-2030) by Source, Type, Process and Region.
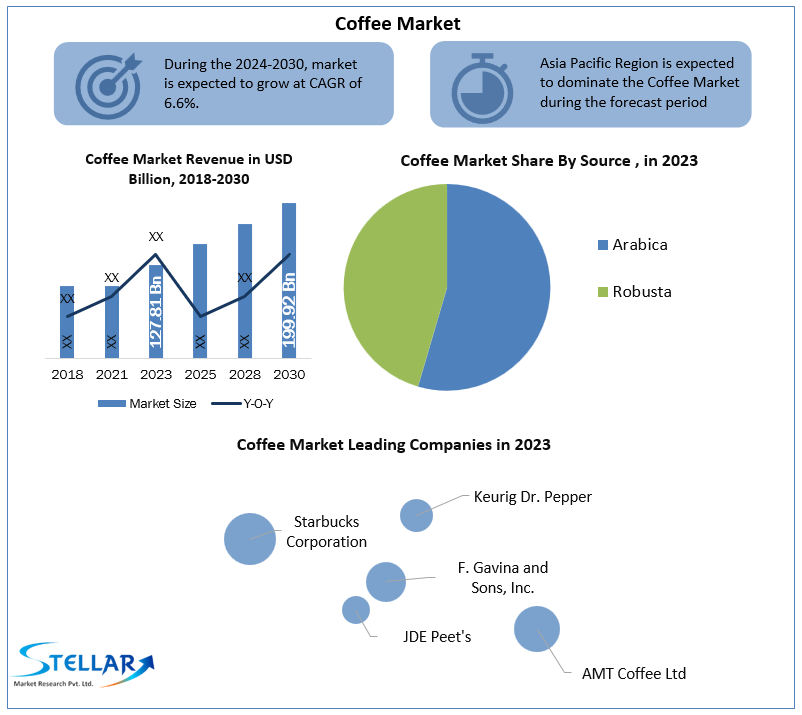
Coffee Market size was valued at US$ 127.81 Bn. in 2023. Coffee will encourage a great deal of transformation in Beverage Sector across Globe.
Format : PDF | Report ID : SMR_55
Coffee Market Overview:
The global level coffee market is analysed on the basis of segments such as source, type, process and region. Coffee is a brewed beverage made from roasted coffee beans, which are the fruit seeds of certain types of coffee. Grains are separated from the coffee berries to obtain a stable raw product, unroasted green coffee. The seeds are then roasted into a consumable product. Roasted coffee is crushed into small pieces, usually soaked in hot water, and then filtered to make a cup of coffee. Coffee is one of the largest agricultural products which is exported across the globe and supports millions of coffee plantations and coffee bean roasters.
Arabica and Robusta are two major types of plants used to make different sub-branches of coffee beans with different palette notes, flavors, and caffeine content
To get more Insights: Request Free Sample Report
Coffee Market Dynamics:
Caffeine is the most widely consumed psychotropic drug across the globe and some of its behavioral effects are similar to cocaine, amphetamines, and other stimulants.
Coffee prices reached a new record from the low levels experienced over the last three years. The major factor responsible for driving the coffee market is weather conditions in Brazil and covid-related disruption which have affected trade in the Asia Pacific region.
The rising trend of unique coffee blends is becoming more popular and great helps in coffee market growth. Coffee Stores and full-service restaurants are offering blends to improve gut health, boost metabolism and support the immune system. Mixtures such as matcha latte, mushroom coffee are on the rise and reduce fat with soy and collagen whiteners.
Demand for snap chilled coffee is surging across the globe and it is becoming a major trend in the market. Snap chilled coffee takes less time to make than a cold brew and does not require the addition of ice cubes to dilute the coffee. This extracts more flavors and more attractive aromas than the cold brew process. There is no wasted cold freshly brewed coffee. These trends are driving the demand for coffee market.
Coffee tourism is becoming a trending thing. Millennials often see coffee as an overall experience, so many young people seek coffee in popular growing areas. Coffee tourism is officially the next big thing, and millennials are looking for a more authentic experience in unique cafes around the globe. Millennials are also looking for stores that offer unique coffee presentations, fascinating photos of coffee farms, educational experiences, and more.
Butter coffee is becoming a popular trend-especially for those who don't have breakfast on the go. Butter coffee is coffee refined with a tablespoon of butter. Butter makes coffee more nutritious and more effective. Popular with celebrities and professional athletes, trends spread and become cults. This is also a simple improvement that allows retailers to significantly increase the price of a cup of coffee.
Health benefits of coffee such as reducing the risk of diabetes, fat burning, and high energy intake from caffeine spikes is increasing and the demand for coffee and the popularity of younger is increasing. The growth of local and global franchise coffee shops is driving the demand for a variety of coffee as customers are willing to pay for the high-quality coffee that has become a medium for socializing.
During this year, Coffee subscriptions have become another great alternative for consumers who want their coffee delivered to them. The pandemic influenced the rise of coffee subscriptions as it gave consumers the opportunity to still receive their daily fix of coffee without having to leave the house during the lockdown. Coffee subscriptions offer consumers the option to try unique, high-end blends which they aren't aware of.

Coffee Market Segment Analysis:
By Source, the Arabica segment dominated the global coffee market with 70% in 2023. It is with low caffeine content, sweet taste, and the widespread use of cafes in developing countries, coupled with the increased use of arabica beans in chocolate, nuts, and caramel. Arabica is a premium class coffee with a sweet and soft taste, with sugar, fruit, and berry flavors on the palette. Mass consumers and coffee shops choose the best coffee blend for arabica coffee beans. These factors are driving the growth of the segment through the forecast period.

Robusta is expected to grow at a CAGR of 4.2% through the forecast period. Robusta coffee beans have a high caffeine content, which makes them less sour and much stronger. These beans are strong and tasty, with a pleasant chocolate aroma in the mouth. These beans are a rich source of natural antioxidants that act as natural anti-inflammatory agents. It also helps reduce the risk of various illnesses such as Alzheimer's disease and gallbladder stones and promotes weight loss. These factors are expected to drive the growth of the segment in the coffee market through the forecast period.
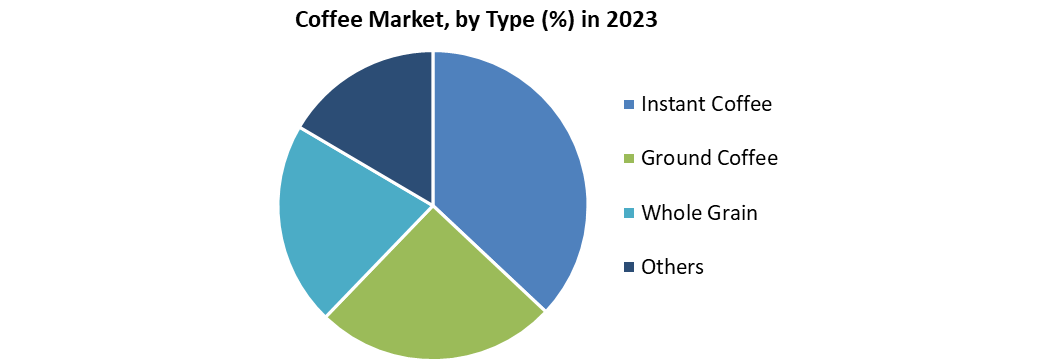
By Type, Instant coffee dominated the market with 37 % share in coffee market. Instant coffee differs from fresh coffee in that it dissolves completely when dry coffee is added to water. It can be brewed in a mug without any special equipment. Instant coffee is made from dehydrated, freshly brewed coffee. After brewing coffee, it is dried to leave a powder and can be stored and rehydrated at any time. Instant coffee is very similar to fresh coffee in that it has the same origin. Instant coffee is mainly consumed, easy to prepare, and delicious. For this reason, large instant coffee brands are in great demand. It is also used in vending machines, small cafes, and around homes. These factors are driving the growth of the segment in the market.
Ground coffee is expected to grow at a CAGR of 5 % through the forecast period. Ground coffee is made from whole coffee beans. Fresh beans are processed on the plantation and shipped to coffee shops and factories. Coffee shops and factories are ready to roast to give it a nice strong taste. Roasting draws out all the rich oil and sweetens the coffee. The increasing demand for these, attractive packaging, etc. are the factors expected to drive the growth of the segment in the coffee market through the forecast period.
By Process, the Caffeinated segment dominated the global coffee market with a 56% share. Arabica beans and Robusta beans are widely used because they contain caffeine. Robusta contains 2.7 fines, which is almost twice as much as 1.5% of Arabica. In addition, the Arabica type is preferred over Robusta because it tastes good, has almost 60% fat, and almost twice the sugar content of Robusta. Coffea arabica coffee trees make up more than 60% of coffee cultivation. These factors are driving the demand of this segment in the coffee market.
The decaffeinated segment is expected to grow at a CAGR of 6.3% in coffee market throughout the forecast period. Decaffeinated coffee, known as decaf for short, is ordinary coffee that has had most of its caffeine removed from it before the beans are roasted. Millennial generations are better aware of the health benefits of decaffeinated beverages, such as improved metabolism and endurance, and are organically and sustainably cultivated decaffeinated, and lightly roasted coffee. I like beans. Due to the growing demand for decaffeinated coffee, many cafes, coffee houses, restaurants, and pubs have included the above variations of their products in their menus. These factors are expected to drive the growth of the segment through the forecast period.
Coffee Market Regional Analysis:
North American region dominated the market with a 66 % share in 2023. The average coffee consumption in the United States is about three cups a day. Large companies have started and expanded their businesses in the region due to a large number of coffee consumers. Demand for coffee makers is increasing at train stations, airports, offices, etc., and the demand for the working population is also increasing. This region is one of the major producers of coffee. These factors are driving the demand for the coffee market in this region.
Asia Pacific Region is expected to grow at a CAGR of 20 % through the forecast period. Coffee consumption is increasing in Asian countries such as China, Japan, South Korea, Indonesia, the Philippines, Malaysia, and Thailand. International coffee chains like Starbucks Corporation, have rapidly expanded their branches in these countries, increasing disposable income, rising coffee trends, etc. These factors are expected to drive the growth of the APAC coffee market through the forecast period.
Coffee Market Scope:
|
Coffee Market |
|
|
Market Size in 2023 |
USD 127.81 Bn. |
|
Market Size in 2030 |
USD 199.92 Bn. |
|
CAGR (2024-2030) |
6.6% |
|
Historic Data |
2018-2022 |
|
Base Year |
2023 |
|
Forecast Period |
2024-2030 |
|
Segment Scope |
By Source
|
|
By Type
|
|
|
By Process
|
|
|
By Geography
|
|
|
Regional Scope |
North America- United States, Canada, and Mexico Europe – UK, France, Germany, Italy, Spain, Sweden, Austria, and Rest of Europe Asia Pacific – China, India, Japan, South Korea, Australia, ASEAN, Rest of APAC Middle East and Africa - South Africa, GCC, Egypt, Nigeria, Rest of the Middle East and Africa South America – Brazil, Argentina, Rest of South America |
KEY PLAYERS:
- The Busy Bean.
- Boston Barista.
- Jumpstart Coffee.
- Mugs Coffee.
- The Steam Room.
- Espresso Express.
- Nestle
- JM Smucker Company
- The Kraft Heinz Company
- Starbucks Corporation
- Keurig Dr. Pepper
- F. Gavina and Sons, Inc.
- JDE Peet's
- AMT Coffee Ltd
- Lavazza
- Trung Nguyen
- Steamy Beans Coffee.
Frequently Asked Questions
Chapter 1 Scope of the Report
Chapter 2 Research Methodology
2.1. Research Process
2.2. Global Coffee Market: Target Audience
2.3. Global Coffee Market: Primary Research (As per Client Requirement)
2.4. Global Coffee Market: Secondary Research
Chapter 3 Executive Summary
Chapter 4 Competitive Landscape
4.1. Market Share Analysis, By Value, 2023-2030
4.1.1. Market Share Analysis, By Region, By Value, 2023-2030 (In %)
4.1.1.1. North America Market Share Analysis, By Value, 2023-2030 (In %)
4.1.1.2. Europe Market Share Analysis, By Value, 2023-2030 (In %)
4.1.1.3. Asia Pacific Market Share Analysis, By Value, 2023-2030 (In %)
4.1.1.4. South America Market Share Analysis, By Value, 2023-2030 (In %)
4.1.1.5. Middle East and Africa Market Share Analysis, By Value, 2023-2030 (In %)
4.1.2. Market Share Analysis, By Source, By Value, 2023-2030 (In %)
4.1.2.1. North America Market Share Analysis, By Source, By Value, 2023-2030 (In %)
4.1.2.1.1. USA Market Share Analysis, By Source, By Value, 2023-2030 (In %)
4.1.2.1.2. Canada Market Share Analysis, By Source, By Value, 2023-2030 (In %)
4.1.2.1.3. Mexico Market Share Analysis, By Source, By Value, 2023-2030 (In %)
4.1.2.2. Europe Market Share Analysis, By Source, By Value, 2023-2030 (In %)
4.1.2.2.1. UK Market Share Analysis, By Source, By Value, 2023-2030 (In %)
4.1.2.2.2. France Market Share Analysis, By Source, By Value, 2023-2030 (In %)
4.1.2.2.3. Germany Market Share Analysis, By Source, By Value, 2023-2030 (In %)
4.1.2.2.4. Italy Market Share Analysis, By Source, By Value, 2023-2030 (In %)
4.1.2.2.5. Spain Market Share Analysis, By Source, By Value, 2023-2030 (In %)
4.1.2.2.6. Sweden Market Share Analysis, By Source, By Value, 2023-2030 (In %)
4.1.2.2.7. Austria Market Share Analysis, By Source, By Value, 2023-2030 (In %)
4.1.2.2.8. Rest of Europe Market Share Analysis, By Source, By Value, 2023-2030 (In %)
4.1.2.3. Asia Pacific Market Share Analysis, By Source, By Value, 2023-2030 (In %)
4.1.2.3.1. China Market Share Analysis, By Source, By Value, 2023-2030 (In %)
4.1.2.3.2. India Market Share Analysis, By Source, By Value, 2023-2030 (In %)
4.1.2.3.3. Japan Market Share Analysis, By Source, By Value, 2023-2030 (In %)
4.1.2.3.4. South Korea Market Share Analysis, By Source, By Value, 2023-2030 (In %)
4.1.2.3.5. Australia Market Share Analysis, By Source, By Value, 2023-2030 (In %)
4.1.2.3.6. ASEAN Market Share Analysis, By Source, By Value, 2023-2030 (In %)
4.1.2.3.7. Rest of APAC Market Share Analysis, By Source, By Value, 2023-2030 (In %)
4.1.2.4. South America Market Share Analysis, By Source, By Value, 2023-2030 (In %)
4.1.2.4.1. Brazil Market Share Analysis, By Source, By Value, 2023-2030 (In %)
4.1.2.4.2. Argentina Market Share Analysis, By Source, By Value, 2023-2030 (In %)
4.1.2.4.3. Rest of South America Market Share Analysis, By Source, By Value, 2023-2030 (In %)
4.1.2.5. Middle East and Africa Market Share Analysis, By Source, By Value, 2023-2030 (In %)
4.1.2.5.1. South Africa Market Share Analysis, By Source, By Value, 2023-2030 (In %)
4.1.2.5.2. GCC Market Share Analysis, By Source, By Value, 2023-2030 (In %)
4.1.2.5.3. Egypt Market Share Analysis, By Source, By Value, 2023-2030 (In %)
4.1.2.5.4. Nigeria Market Share Analysis, By Source, By Value, 2023-2030 (In %)
4.1.2.5.5. Rest of Middle East and Africa Market Share Analysis, By Source, By Value, 2023-2030 (In %)
4.1.3. Market Share Analysis, By Type, By Value, 2023-2030 (In %)
4.1.4. North America Market Share Analysis, By Type, By Value, 2023-2030 (In %)
4.1.4.1.1. USA Market Share Analysis, By Type, By Value, 2023-2030 (In %)
4.1.4.1.2. Canada Market Share Analysis, By Type, By Value, 2023-2030 (In %)
4.1.4.1.3. Mexico Market Share Analysis, By Type, By Value, 2023-2030 (In %)
4.1.4.2. Europe Market Share Analysis, By Type, By Value, 2023-2030 (In %)
4.1.4.2.1. UK Market Share Analysis, By Type, By Value, 2023-2030 (In %)
4.1.4.2.2. France Market Share Analysis, By Type, By Value, 2023-2030 (In %)
4.1.4.2.3. Germany Market Share Analysis, By Type, By Value, 2023-2030 (In %)
4.1.4.2.4. Italy Market Share Analysis, By Type, By Value, 2023-2030 (In %)
4.1.4.2.5. Spain Market Share Analysis, By Type, By Value, 2023-2030 (In %)
4.1.4.2.6. Sweden Market Share Analysis, By Type, By Value, 2023-2030 (In %)
4.1.4.2.7. Austria Market Share Analysis, By Type, By Value, 2023-2030 (In %)
4.1.4.2.8. Rest of Europe Market Share Analysis, By Type, By Value, 2023-2030 (In %)
4.1.4.3. Asia Pacific Market Share Analysis, By Type, By Value, 2023-2030 (In %)
4.1.4.3.1. China Market Share Analysis, By Type, By Value, 2023-2030 (In %)
4.1.4.3.2. India Market Share Analysis, By Type, By Value, 2023-2030 (In %)
4.1.4.3.3. Japan Market Share Analysis, By Type, By Value, 2023-2030 (In %)
4.1.4.3.4. South Korea Market Share Analysis, By Type, By Value, 2023-2030 (In %)
4.1.4.3.5. Australia Market Share Analysis, By Type, By Value, 2023-2030 (In %)
4.1.4.3.6. ASEAN Market Share Analysis, By Type, By Value, 2023-2030 (In %)
4.1.4.3.7. Rest of APAC Market Share Analysis, By Type, By Value, 2023-2030 (In %)
4.1.4.4. South America Market Share Analysis, By Type, By Value, 2023-2030 (In %)
4.1.4.4.1. Brazil Market Share Analysis, By Type, By Value, 2023-2030 (In %)
4.1.4.4.2. Argentina Market Share Analysis, By Type, By Value, 2023-2030 (In %)
4.1.4.4.3. Rest of South America Market Share Analysis, By Type, By Value, 2023-2030 (In %)
4.1.4.5. Middle East and Africa Market Share Analysis, By Type, By Value, 2023-2030 (In %)
4.1.4.5.1. South Africa Market Share Analysis, By Type, By Value, 2023-2030 (In %)
4.1.4.5.2. GCC Market Share Analysis, By Type, By Value, 2023-2030 (In %)
4.1.4.5.3. Egypt Market Share Analysis, By Type, By Value, 2023-2030 (In %)
4.1.4.5.4. Nigeria Market Share Analysis, By Type, By Value, 2023-2030 (In %)
4.1.4.5.5. Rest of Middle East and Africa Market Share Analysis, By Type, By Value, 2023-2030 (In %)
4.1.5. Market Share Analysis, By Process, By Value, 2023-2030 (In %)
4.1.6. North America Market Share Analysis, By Process, By Value, 2023-2030 (In %)
4.1.6.1.1. USA Market Share Analysis, By Process, By Value, 2023-2030 (In %)
4.1.6.1.2. Canada Market Share Analysis, By Process, By Value, 2023-2030 (In %)
4.1.6.1.3. Mexico Market Share Analysis, By Process, By Value, 2023-2030 (In %)
4.1.6.2. Europe Market Share Analysis, By Process, By Value, 2023-2030 (In %)
4.1.6.2.1. UK Market Share Analysis, By Process, By Value, 2023-2030 (In %)
4.1.6.2.2. France Market Share Analysis, By Process, By Value, 2023-2030 (In %)
4.1.6.2.3. Germany Market Share Analysis, By Process, By Value, 2023-2030 (In %)
4.1.6.2.4. Italy Market Share Analysis, By Process, By Value, 2023-2030 (In %)
4.1.6.2.5. Spain Market Share Analysis, By Process, By Value, 2023-2030 (In %)
4.1.6.2.6. Sweden Market Share Analysis, By Process, By Value, 2023-2030 (In %)
4.1.6.2.7. Austria Market Share Analysis, By Process, By Value, 2023-2030 (In %)
4.1.6.2.8. Rest of Europe Market Share Analysis, By Process, By Value, 2023-2030 (In %)
4.1.6.3. Asia Pacific Market Share Analysis, By Process, By Value, 2023-2030 (In %)
4.1.6.3.1. China Market Share Analysis, By Process, By Value, 2023-2030 (In %)
4.1.6.3.2. India Market Share Analysis, By Process, By Value, 2023-2030 (In %)
4.1.6.3.3. Japan Market Share Analysis, By Process, By Value, 2023-2030 (In %)
4.1.6.3.4. South Korea Market Share Analysis, By Process, By Value, 2023-2030 (In %)
4.1.6.3.5. Australia Market Share Analysis, By Process, By Value, 2023-2030 (In %)
4.1.6.3.6. ASEAN Market Share Analysis, By Process, By Value, 2023-2030 (In %)
4.1.6.3.7. Rest of APAC Market Share Analysis, By Process, By Value, 2023-2030 (In %)
4.1.6.4. South America Market Share Analysis, By Process, By Value, 2023-2030 (In %)
4.1.6.4.1. Brazil Market Share Analysis, By Process, By Value, 2023-2030 (In %)
4.1.6.4.2. Argentina Market Share Analysis, By Process, By Value, 2023-2030 (In %)
4.1.6.4.3. Rest of South America Market Share Analysis, By Process, By Value, 2023-2030 (In %)
4.1.6.5. Middle East and Africa Market Share Analysis, By Process, By Value, 2023-2030 (In %)
4.1.6.5.1. South Africa Market Share Analysis, By Process, By Value, 2023-2030 (In %)
4.1.6.5.2. GCC Market Share Analysis, By Process, By Value, 2023-2030 (In %)
4.1.6.5.3. Egypt Market Share Analysis, By Process, By Value, 2023-2030 (In %)
4.1.6.5.4. Nigeria Market Share Analysis, By Process, By Value, 2023-2030 (In %)
4.1.6.5.5. Rest of Middle East and Africa Market Share Analysis, By Process, By Value, 2023-2030 (In %)
4.2. Stellar Competition matrix
4.2.1. Global Stellar Competition Matrix
4.2.2. North America Stellar Competition Matrix
4.2.3. Europe Stellar Competition Matrix
4.2.4. Asia Pacific Stellar Competition Matrix
4.2.5. South America Stellar Competition Matrix
4.2.6. Middle East and Africa Stellar Competition Matrix
4.3. Key Players Benchmarking
4.3.1. Key Players Benchmarking by Source, Pricing, Market Share, Investments, Expansion Plans, Physical Presence and Presence in the Market.
4.4. Mergers and Acquisitions in Industry
4.4.1. M&A by Region, Value and Strategic Intent
4.5. Market Dynamics
4.5.1. Market Drivers
4.5.2. Market Restraints
4.5.3. Market Opportunities
4.5.4. Market Challenges
4.5.5. PESTLE Analysis
4.5.6. PORTERS Five Force Analysis
4.5.7. Value Chain Analysis
Chapter 5 Global Coffee Market Segmentation: By Source
5.1. Global Coffee Market, By Source, Overview/Analysis, 2023-2030
5.2. Global Coffee Market, By Source, By Value, Market Share (%), 2023-2030 (USD Million)
5.3. Global Coffee Market, By Source, By Value,
5.3.1. Arabica
5.3.2. Robusta
Chapter 6 Global Coffee Market Segmentation: By Type
6.1. Global Coffee Market, By Type, Overview/Analysis, 2023-2030
6.2. Global Coffee Market Size, By Type, By Value, Market Share (%), 2023-2030 (USD Million)
6.3. Global Coffee Market, By Type, By Value,
6.3.1. Instant Coffee
6.3.2. Ground Coffee
6.3.3. Whole Grain
6.3.4. Others
Chapter 7 Global Coffee Market Segmentation: By Process
7.1. Global Coffee Market, By Process, Overview/Analysis, 2023-2030
7.2. Global Coffee Market Size, By Process, By Value, Market Share (%), 2023-2030 (USD Million)
7.3. Global Coffee Market, By Process, By Value,
7.3.1. Caffeinated
7.3.2. Decaffeinated
Chapter 8 Global Coffee Market Segmentation: By Region
8.1. Global Coffee Market, By Region – North America
8.1.1. North America Coffee Market Size, By Source, By Value, 2023-2030 (USD Million)
8.1.2. North America Coffee Market Size, By Type, By Value, 2023-2030 (USD Million)
8.1.3. North America Coffee Market Size, By Process, By Value, 2023-2030 (USD Million)
8.1.4. By Country – U.S.
8.1.4.1. U.S. Coffee Market Size, By Source, By Value, 2023-2030 (USD Million)
8.1.4.2. U.S. Coffee Market Size, By Type, By Value, 2023-2030 (USD Million)
8.1.4.3. U.S. Coffee Market Size, By Process, By Value, 2023-2030 (USD Million)
8.1.4.4. Canada Coffee Market Size, By Value, 2023-2030 (USD Million)
8.1.4.5. Mexico Coffee Market Size, By Value, 2023-2030 (USD Million)
8.2. Europe Coffee Market Size, By Value, 2023-2030 (USD Million)
8.2.1. UK
8.2.2. France
8.2.3. Germany
8.2.4. Italy
8.2.5. Spain
8.2.6. Sweden
8.2.7. Austria
8.2.8. Rest of Europe
8.3. Asia Pacific Coffee Market Size, By Value, 2023-2030 (USD Million)
8.3.1. China
8.3.2. India
8.3.3. Japan
8.3.4. South Korea
8.3.5. Australia
8.3.6. ASEAN
8.3.7. Rest of APAC
8.4. Middle East and Africa Coffee Market Size, By Value, 2023-2030 (USD Million)
8.4.1. South Africa
8.4.2. GCC
8.4.3. Egypt
8.4.4. Nigeria
8.4.5. Rest of Middle East and Africa
8.5. South America Coffee Market Size, By Value, 2023-2030 (USD Million)
8.5.1. Brazil
8.5.2. Argentina
8.5.3. Rest of South America
Chapter 9 Company Profiles
9.1. Key Players
9.1.1. The Busy Bean.
9.1.1.1. Company Overview
9.1.1.2. Source Portfolio
9.1.1.3. Financial Overview
9.1.1.4. Business Strategy
9.1.1.5. Key Developments
9.1.2. Boston Barista.
9.1.3. Jumpstart Coffee.
9.1.4. Mugs Coffee.
9.1.5. The Steam Room.
9.1.6. Espresso Express.
9.1.7. Nestle
9.1.8. JM Smucker Company
9.1.9. The Kraft Heinz Company
9.1.10. Starbucks Corporation
9.1.11. Keurig Dr. Pepper
9.1.12. F. Gavina and Sons, Inc.
9.1.13. JDE Peet's
9.1.14. AMT Coffee Ltd
9.1.15. Lavazza
9.1.16. Trung Nguyen
9.1.17. Steamy Beans Coffee
9.2. Key Findings
9.3. Recommendations


