India Bike Sharing Market: Industry Analysis and Forecast (2024-2030) by Component, Level of Automation, Fuel Type, and Region.
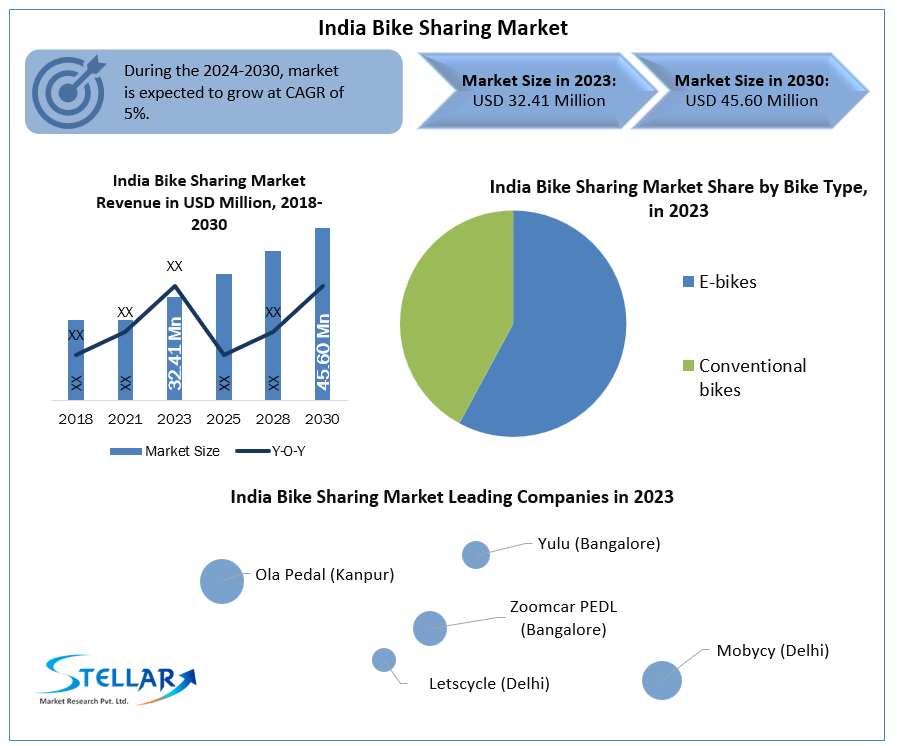
India Bike Sharing Market size was valued at US$ 32.41 Million in 2023 and the total India Bike Sharing Market revenue is expected to grow at 5% through 2024 to 2030, reaching nearly US$ 45.60 Million.
Format : PDF | Report ID : SMR_221
India Bike Sharing Market Overview:
Cycling, a sustainable, healthy and affordable way to travel, has regained popularity during pandemics due to the distance cars and buses from the road. During the blockade in the UK, the cycle-to-work scheme increased bicycle orders from rescuers by 200%. In India, the bicycle industry is expected to grow by 15-20% in 2020, compared to 5-7% last year, according to the Association of All Indian Cycle Manufacturers. It is important to maintain cycling momentum as traffic in Indian cities almost returns to pre-pandemic levels. Cities are actively planning infrastructure to encourage and encourage non-motorized transportation, such as walking and cycling between commuters. In cities, you should consider implementing a public bicycle sharing (PBS) scheme. This is a flexible transportation service that allows users to rent a bicycle for a short period of time, a cheap, sustainable and socially distant way to commute.
India Bike Sharing Market Dynamics:
Approximately 35% of vehicle travel in India is short distances (less than 5 km), creating a huge potential market for cycling. PBS gives citizens the flexibility to rent and share their bikes for short trips at low rates without having to worry about repairing their bikes themselves.
Most PBS users cover shorter distances (about 2 kilometers) by bicycle. Located on public transport hubs in poorly connected areas, the PBS system helps extend the reach of these services by providing first and last mile connections. In addition, the PBS system provides affordable transportation to a wide range of users through innovative pricing models such as long-term subscriptions.
The PBS system typically has different types of bikes, including regular bikes, geared bikes, electric bikes, pedal-assisted bikes, and different rental models such as one-time rentals, subscriptions, and long-term rentals. Local governments often use PBS as part of their community-based services, but public transport, whose primary task is to increase passenger numbers, is a feeder to major modes of transportation such as buses and subways. I am using these systems. In Mysuru, Trin Trin, an initiative of Green Wheel Rides, has 450 bicycles throughout forty eight docking stations and furnished approximately 1,000 rides consistent with day earlier than COVID-19. Currently, the PBS presenting is seeing 8-10 new registrations consistent with day (typically leisure riders) and offering 300-500 rides a day. In addition to Mysuru, the PBS system has been introduced in Indian cities such as Bhopal and Kochi. However, many suffer from challenges such as lack of funding for walking and cycling projects, inconsistencies in goals, or simply lack of existing cycling culture and ecosystem.
To get more Insights: Request Free Sample Report
The best approach to a successful PBS system is to develop a strategy that can identify the right combination of vendors, operating models, and revenue streams that are fully managed and deployed to provide value to end users and service providers. Is to do. While Indian PBS operators have experimented with several strategies in silos, a more participatory approach by city stakeholders provides an overall solution and adds value to different stakeholders. It is important to do. In September 2020, WRI India and the Karnataka City Land Transport Authority need to strengthen government intervention in infrastructure development, policy setting and co-funding of the PBS program in a focus group discussion with Indian cyclists. I emphasized that there is. This is a follow-up to DULT's efforts to promote urban cycling following the 2018 innovative PBS deployment permit model.
The best approach to a successful PBS system is to develop a strategy that can identify the right combination of vendors, operating models, and revenue streams that are fully managed and deployed to provide value to end users and service providers. Is to do. While Indian PBS operators have experimented with several strategies in silos, a more participatory approach by city stakeholders provides an overall solution and adds value to different stakeholders. It is important to do. In September 2020, WRI India and the Karnataka City Land Transport Authority need to strengthen government intervention in infrastructure development, policy setting and co-funding of the PBS program in a focus group discussion with Indian cyclists. I emphasized that there is. This is a follow-up to DULT's efforts to promote urban cycling following the 2018 innovative PBS deployment permit model.
|
Sr.No. |
Company |
City |
Year Service was Deployed |
INR Price for 30 Min. |
INR Price for 60 Min. |
|
1. |
YULU |
Bengaluru |
2018 |
10 |
15 |
|
2. |
TRINTRIN |
Mysore |
2017 |
0 |
5 |
|
3. |
Smart Bike |
Delhi |
2018 |
10 |
25 |
|
4. |
MYBYK |
Mumbai |
2020 |
2 |
2 |
|
5. |
COO Ride |
Thane |
2018 |
15 |
30 |
|
6. |
Chartered Bike |
Bhopal |
2017 |
5 |
10 |
|
7. |
Chartered Bike |
Ranchi |
2019 |
0 |
5 |
|
8. |
Chartered Bike |
Surat |
2020 |
0 |
5 |
So far, the government has played a passive role and is more dependent on private investment, which has been successful with only a few counts. The Ministry of Housing and Urban Affairs suggests that increasing government investment in pilot projects may help determine the best financial model for building and maintaining a PBS system in India. More commuting to create the right end-to-end PBS system to attract and maintain riders, focus on ensuring safety, identify suitable areas for cycling, and experiment with innovative customer acquisition models. You also need to take a person-centric approach.
Challenges with Bike Sharing in India:
The main obstacle is the previous profitability of the stationery project. When the scheme was formed with bicycle companies in India, they mainly focused on the implementation of large-scale PBS using traditional bicycles in cities such as Pune, Delhi, Coimbatore, Bhopal and other India. Focused on a small pilot project in the city of India. In Mumbai, bicycles make up the overwhelming 1% of the total itinerary, far less than in other Indian cities. Through the Station Access and Mobility Program (STAMP), a challenge sponsored by WRI India and the Toyota Mobility Foundation together with the Mumbai Metropolitan Regional Development Bureau and Mumbai Metro, the city has introduced bicycles to several subway stations and is the last mile.
When a PBS project is launched in a new city, it usually first attracts the attention of recreational and curious drivers. However, this business model requires immediate acceptance by others, such as commuters. Capital spending on installing stations and vehicles is high, operating costs to supply vehicles to stations are high, but rental fees are low (according to discussions with WRI India's cyclists, India Is a price-sensitive market). In many Indian cities, poor consumer acceptance has led companies to withdraw from the market and reduce losses early.
Cycling Mode Share in Indian Cities:
To understand the economic requirements for running PBS, we referred to the detailed project report of the Pune plan drafted in 2017 and planned 4,500-5,000 bicycles at 388 stations. The cost of capital for infrastructure construction and bicycle purchase was set at Rs. 481-731 million (US $ 6.5-10 million) in the first year, and the recurring cost (operation, maintenance, etc.) was set at Rs. 124-166 million. However, sales were estimated at only 40 million rupees. At Pune, projected costs have fallen sharply over the last few years, but the gap between revenue and operating costs remains large, surpassing Rs. 27,000 per vehicle in the first year and Rs 16,000 in the seventh year. Rice field. Similar numbers have been calculated in Panaji's research, indicating that such initiatives cannot be impacted without the support of infrastructure and cycling culture.
Viability Gap in Indian Market:
The total cost of capital for a system size of 500 bicycles is estimated at around Rs 3.09 million (30.9 million Indian rupees) at a price in 2020. This corresponds to a cost of capital of approximately Rs 60,000 per cycle or Rs 50 per cycle per day, including the cost of capital service (assuming a plant life of 5 years). Farebox is the most common source of income for the PBS system in India. The first 30 minutes will be provided free of charge to registered system users who have paid a membership fee. The number of passengers decreased when the Mysuru system tried to charge for the first 30 minutes. The decision was overturned. Analysis of primary data revealed that approximately 80% of PBS users' travel time was within 30 minutes. As a result, the percentage of fare revenue is usually less than what is needed to cover operating expenses. Subsidies such as station advertising can generate revenue equivalent to the fare (Bhopal), but the use of these rights, even if contractually allocated, is associated with street advertising rights already granted to other institutions. Facing institutional difficulties due to competition (lunch) or city-level ban (Mysuru).
The objective of the report is to present a comprehensive analysis of the India Bike Sharing Market to the stakeholders in the industry. The report provides trends that are most dominant in the India Bike Sharing Market and how these trends will influence new business investments and market development throughout the forecast period. The report also aids in the comprehension of the India Bike Sharing Market dynamics and competitive structure of the market by analyzing market leaders, market followers, and regional players.
The qualitative and quantitative data provided in the India Bike Sharing Market report is to help understand which market segments, regions are expected to grow at higher rates, factors affecting the market, and key opportunity areas, which will drive the industry and market growth through the forecast period. The report also includes the competitive landscape of key players in the industry along with their recent developments in the India Bike Sharing Market. The report studies factors such as company size, market share, market growth, revenue, production volume, and profits of the key players in the India Bike Sharing Market.
The report provides Porter's Five Force Model, which helps in designing the business strategies in the market. The report helps in identifying how many rivals are existing, who they are, and how their product quality is in the Market. The report also analyses if the India Bike Sharing Market is easy for a new player to gain a foothold in the market, do they enter or exit the market regularly if the market is dominated by a few players, etc.
The report also includes a PESTEL Analysis, which aids in the development of company strategies. Political variables help in figuring out how much a government can influence the Market. Economic variables aid in the analysis of economic performance drivers that have an impact on the Market. Understanding the impact of the surrounding environment and the influence of environmental concerns on the India Bike Sharing Market is aided by legal factors.
India Bike Sharing Market Scope:
|
India Bike Sharing Market Scope |
|
|
Market Size in 2023 |
USD 32.41 Mn. |
|
Market Size in 2030 |
USD 45.60 Mn. |
|
CAGR (2024-2030) |
5% |
|
Historic Data |
2018-2022 |
|
Base Year |
2023 |
|
Forecast Period |
2024-2030 |
|
Segment Scope |
By Model
|
|
By Model
|
|
|
|
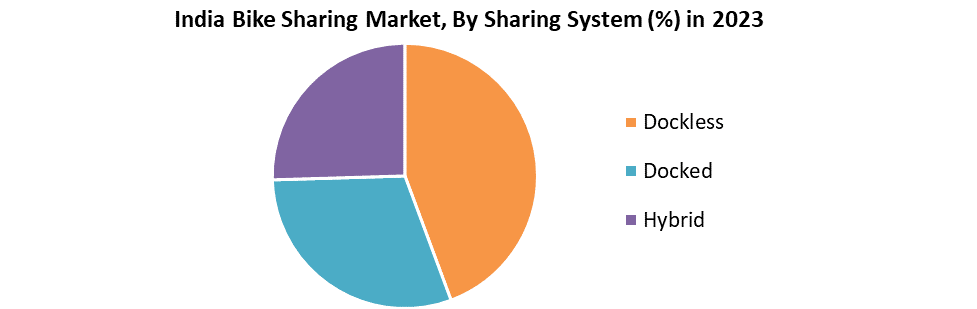
By Sharing System
|
India Bike Sharing Market Players:
- Ola Pedal (Kanpur)
- Yulu (Bangalore)
- Zoomcar PEDL (Bangalore)
- Letscycle (Delhi)
- Zypp
- Mobycy (Delhi)
- Ofo (China)
- Mobike (China)
Frequently Asked Questions
Delhi, Bangalore, Mumbai, Pune, Chandigarh and Mysore region have the highest growth rate in the India Bike Sharing market.
Ola Pedal,Yulu, Zoomcar PEDL, Letscycle, Zypp, Mobycy, Ofo, Mobike are the key players in the India Bike Sharing market.
Docked sharing segment is dominating the market with highest share owing to abundance of docking stations in the metro regions of India owing to smart city initiative by government.
Chapter 1 Scope of the Report
Chapter 2 Research Methodology
2.1.Research Sharing System
2.2.India Bike Sharing Market: Target Audience
2.3.India Bike Sharing Market: Primary Research (As per Client Requirement)
2.4.India Bike Sharing Market: Secondary Research
Chapter 3 Executive Summary
Chapter 4 Competitive Landscape
4.1.Market Share Analysis, By Value, 2023-2030
4.1.1.India Market Share Analysis, By Bike Type, By Value, 2023-2030 (In %)
4.1.2.India Market Share Analysis, By Model, By Value, 2023-2030 (In %)
4.1.3.India Market Share Analysis, By Sharing System, By Value, 2023-2030 (In %)
4.2. Stellar Competition matrix
4.2.1.India Stellar Competition Matrix
4.3. Key Players Benchmarking
4.3.1.Key Players Benchmarking by Bike Type, Pricing, Market Share, Investments, Expansion Plans, Physical Presence and Presence in the Market.
4.4. Mergers and Acquisitions in Industry
4.4.1.M&A by Region, Value and Strategic Intent
4.5.Market Dynamics
4.5.1.Market Drivers
4.5.2.Market Restraints
4.5.3.Market Opportunities
4.5.4.Market Challenges
4.5.5.PESTLE Analysis
4.5.6.PORTERS Five Force Analysis
4.5.7.Value Chain Analysis
Chapter 5 India Bike Sharing Market Segmentation: By Bike Type
5.1.India Bike Sharing Market, By Bike Type, Overview/Analysis, 2023-2030
5.2.India Bike Sharing Market, By Bike Type, By Value, Market Share (%), 2023-2030 (USD Million)
5.3.India Bike Sharing Market, By Bike Type, By Value, -
5.3.1.E-bikes
5.3.2.Conventional bikes
Chapter 6 India Bike Sharing Market Segmentation: By Model
6.1.India Bike Sharing Market, By Model, Overview/Analysis, 2023-2030
6.2.India Bike Sharing Market Size, By Model, By Value, Market Share (%), 2023-2030 (USD Million)
6.3.India Bike Sharing Market, By Model, By Value, -
6.3.1.Free-floating
6.3.2.P2P
6.3.3.Station based
Chapter 7 India Bike Sharing Market Segmentation: By Sharing System
7.1.India Bike Sharing Market, By Sharing System, Overview/Analysis, 2023-2030
7.2.India Bike Sharing Market Size, By Sharing System, By Value, Market Share (%), 2023-2030 (USD Million)
7.3.India Bike Sharing Market, By Sharing System, By Value, -
7.3.1.Dockless
7.3.2.Docked
7.3.3.Hybrid
Chapter 8 Company Profiles
8.1.Key Players
8.1.1.Ola Pedal (Kanpur)
8.1.1.1.Company Overview
8.1.1.2.Bike Type Portfolio
8.1.1.3.Financial Overview
8.1.1.4.Business Strategy
8.1.1.5.Key Developments
8.1.2.Yulu (Bangalore)
8.1.3.Zoomcar Pedal (Bangalore)
8.1.4.Letscycle (Delhi)
8.1.5.Zypp
8.1.6.Mobycy (Delhi)
8.1.7.Ofo
8.1.8.Mobike
8.2.Key Findings
8.3.Recommendations


