Vegan Food Market Global Industry Analysis and Forecast (2026-2032) by Product, Distribution Channel, and Region
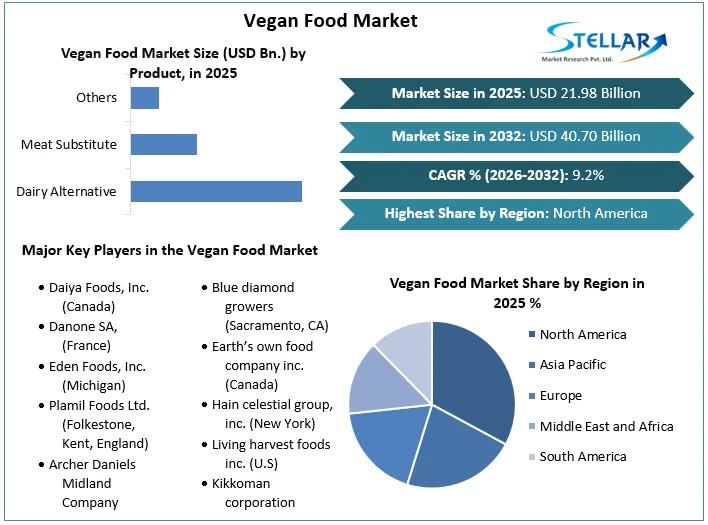
Vegan Food Market size was valued at US$ 21.98 Bn in 2025. Global Vegan Food Market is estimated to grow at a CAGR of 9.2% over the forecast period.
Vegan Food Market Definition:
A vegan diet is made up of a range of nutritious grains, fruits, and vegetables. They are obtained or processed from plant-based sources and are used as meat and animal product substitutes. Vegan foods are high in vitamins B1, C, and E, as well as folic acid, magnesium, and iron, and are low in cholesterol and saturated fats. Various celebrities and athletes are encouraging the consumption of vegan products to maintain a healthy lifestyle due to their high nutritional content. Vegan Food Market's segment analysis is provided on the basis of product, distribution channel and region.
Furthermore, lactose-intolerant people eat vegan pasta dishes like carbonara, semolina, spaghetti, linguine, and ravioli because no milk or by-products are used in their production, resulting in increased vegan food consumption. Vegan food refers to eating habits that do not include the usage of animal products such as stock, fat, roe, eggs, milk, cheese, or meat.
To get more Insights: Request Free Sample Report
Vegan Food Market Dynamics:
The Vegan Food Market is Growing Due to Growing Awareness of Animal Cruelty:
The vegan food market is strengthened by a growing awareness of animal health and cruelty in the food industry, which has resulted in a considerable shift away from animal-based foods and toward plant-based foods. Vegan cuisine is in high demand due to the growing popularity of the vegan diet and the growing trend of practising veganism. For example, the increased popularity of this diet among celebrities has boosted market growth as more and more fans begin to follow suit.
Animal cruelty has been related to an increased risk of criminal violence and domestic abuse. This will aid in the reduction of homeless dogs and animals in shelters, resulting in fewer animals being euthanized each year. Your pet will also benefit from spaying or neutering in terms of health and temperament. This has led to the awareness among vegan foods which is fuelling the growth of the vegan food market.
Vegan meals have several negative side effects:
Low energy and weight problems, leaky gut issues, hormones disruption, lack of iron, risk of vitamin B12 deficiency, and risk of depression are the common side effects of availing the vegan foods. B12 is an essential vitamin, and a lack of it can result in a variety of irreversible health problems. Since vitamin B12 is primarily attained from animal sources, vegans are at a high risk of consuming a scarcity in this crucial constituent. Iron is found in plant-based diets, but it is of the low-heme kind, which is poorly absorbed by the body. As a result, vegetarians and vegans are more susceptible to iron deficiency. A deficiency of heme iron in the body can result in a variety of symptoms, including weariness and anaemia which is a major factor for hampering the growth of the vegan food market.
A selection of high-quality vegan food products is being launched by significant businesses:
To appeal to a broader client base and broaden their product portfolio, leading manufacturers are releasing a range of high-quality vegan food products in a variety of flavours and appealing packaging options. In addition, there is a significant increase in the demand for vegan health and nourishing foods to address nutritional inadequacies.
The availability of ready-to-eat and packaged vegan foods, as well as extensive promotional efforts by celebrities and athletes, are all helping to propel the vegan food sector forward. Restaurants and fast-food establishments are developing vegan-friendly menus in response to the growing popularity of the Veganuary Challenge as a result of numerous awareness campaigns and the increased use of social media, which is predicted to give a huge opportunity for vegan food market.
Vegan Food Market Segment Analysis:
By Product, the market is segmented as Dairy Alternative, Meat Substitute, and Others. Dairy Alternative Segment dominated the vegan food market with a 74.8% share in 2025. Lactose intolerance affects about 65% of the world's population, which is a major factor driving demand for dairy alternatives. Non-vegetarians have been drawn by the availability of a variety of items such as cheese, yoghurt, ice cream, and snacks, which has broadened the consumer base of this market. Manufacturers on the market have produced a variety of high-quality food items in a variety of tastes, all packaged attractively. This will almost certainly help the segment grow. Plant-based cheese accounted for the highest share of the dairy alternatives market. Its demand is likely to be fueled by an expanding product variety as well as an increase in cases of lactose intolerance.
However, The Meat Substitute segment is expected to grow at a CAGR of 5.3% through the forecast period. A meat substitute, also known as a meat analogue, is a product that mimics the aesthetic traits most notably texture, flavour, appearance and chemical characteristics of certain meat. Soybeans such as tofu and tempeh, gluten, and peas are frequently used as substitutes.

By Distribution Channel, the market is segmented as Online and Offline. The Offline segment dominated the vegan food market with a 58% share in 2025. Convenience stores, speciality stores, hypermarkets, and supermarkets all fall within this category. The overall product sales have increased as the number of supermarkets and hypermarkets has grown. Furthermore, because of the convenience and availability of brick-and-mortar supermarkets, consumers prefer to purchase there.
However, The Online segment is expected to grow at a CAGR of 6.3% through the forecast period. Approximately 48% of American consumers buy at least some of their groceries online, and this figure is anticipated to rise shortly. As a result, many large retail chains have made significant investments in online distribution channels around the world. Walmart, a major international retailer, has begun to supply meals via the internet. As a result, the growing number of online grocery platforms is likely to improve product sales online, moving the category forward.
Vegan Food Market Regional Insights:
The North American region dominated the market with a 47% share in 2024. North America led the vegan food market in 2024, owing to an increase in the vegan population in the region as a result of rising concerns about animal cruelty in the food business and its negative environmental impact. Furthermore, the United States has a high population of lactose intolerant persons, which drives demand for alternative dairy products. According to sales figures compiled by SPINS on behalf of trade group Plant-Based Foods Association (PBFA) and advocacy non-profit. The Good Food Institute, American consumers maintained their interest in plant-based foods throughout 2020, with sales of plant-based alternatives to animal products increasing by 27% to $7 billion (GFI).
However, the Asia Pacific region is expected to grow at a CAGR of 8.3% through the forecast period. Rising per capita income in developing countries such as China, India, Thailand, Taiwan, and Bangladesh would aid market expansion. Due to the strong development potential in APAC, key manufacturers in the market have been focusing on expanding their operations there.
The objective of the report is to present a comprehensive analysis of the Global Vegan Food market to the stakeholders in the industry. The report provides trends that are most dominant in the Global Vegan Food market and how these trends will influence new business investments and market development throughout the forecast period. The report also aids in the comprehension of the global market dynamics and competitive structure of the market by analyzing market leaders, market followers, and regional players.
The qualitative and quantitative data provided in the Global Vegan Food market report is to help understand which market segments, regions are expected to grow at higher rates, factors affecting the market, and key opportunity areas, which will drive the industry and market growth through the forecast period. The report also includes the competitive landscape of key players in the industry along with their recent developments in the Global Vegan Food market. The report studies factors such as company size, market share, market growth, revenue, production volume, and profits of the key players in the global market.
The report provides Porter's Five Force Model, which helps in designing the business strategies in the market. The report helps in identifying how many rivals are existing, who they are, and how their product quality is in the Global Vegan Food market. The report also analyses if the Global Vegan Food market is easy for a new player to gain a foothold in the market, do they enter or exit the market regularly if the market is dominated by a few Players, etc.
The report also includes a PESTEL Analysis, which aids in the development of company strategies. Political variables help in figuring out how much a government can influence the Global Vegan Food market. Economic variables aid in the analysis of economic performance drivers that have an impact on the Global Vegan Food market. Understanding the impact of the surrounding environment and the influence of environmental concerns on the global market is aided by legal factors.
Vegan Food Market Scope:
|
Vegan Food Market |
|
|
Market Size in 2025 |
USD 21.98 Bn. |
|
Market Size in 2032 |
USD 40.70 Bn. |
|
CAGR (2026-2032) |
9.2% |
|
Historic Data |
2020-2025 |
|
Base Year |
2025 |
|
Forecast Period |
2026-2032 |
|
Segment Scope |
by Product
|
|
By Distribution Channel
|
|
|
Regional Scope |
North America- United States, Canada, and Mexico Europe – UK, France, Germany, Italy, Spain, Sweden, Austria, and Rest of Europe Asia Pacific – China, India, Japan, South Korea, Australia, ASEAN, Rest of APAC Middle East and Africa - South Africa, GCC, Egypt, Nigeria, Rest of the Middle East and Africa South America – Brazil, Argentina, Rest of South America |
Vegan Food Market Key Players:
- Daiya Foods, Inc. (Canada)
- Danone SA, (France)
- Eden Foods, Inc. (Michigan)
- Plamil Foods Ltd. (Folkestone, Kent, England)
- Archer Daniels Midland Company (Chicago)
- Tofutti Brands, Inc. (U.S)
- VBites Foods Limited, (U.K)
- Vitasoy Australia Products Pty Ltd. (Australia)
- Blue diamond growers (Sacramento, CA)
- Earth’s own food company inc. (Canada)
- Hain celestial group, inc. (New York)
- Living harvest foods inc. (U.S)
- Kikkoman corporation (Japan)
- Pascual group (Spain)
- Sunopta inc. (Canada)
Frequently Asked Questions
The North American region is expected to hold the highest share in the Vegan Food Market.
The market size of the Vegan Food Market is expected to be 40.70 Bn by 2032.
The forecast period for the Vegan Food Market is 2026-2032
The market size of the Vegan Food Market in 2025 was USD 21.98 Bn.
1. Research Methodology
1.1 Research Data
1.1.1. Primary Data
1.1.2. Secondary Data
1.2. Market Size Estimation
1.2.1. Bottom-Up Approach
1.2.2. Top-Up Approach
1.3. Market Breakdown and Data Triangulation
1.4. Research Assumption
2. Vegan Food Market Executive Summary
2.1. Market Overview
2.2. Market Size (2025) and Forecast (2026– 2032) and Y-O-Y%
2.3. Market Size (USD) and Market Share (%) – By Segments and Regions
3. Global Vegan Food Market: Competitive Landscape
3.1. SMR Competition Matrix
3.2. Key Players Benchmarking
3.2.1. Company Name
3.2.2. Headquarter
3.2.3. Product Segment
3.2.4. Total Production (2025)
3.2.5. End-user Segment
3.2.6. Y-O-Y%
3.2.7. Revenue (2025)
3.2.8. Profit Margin
3.2.9. Market Share
3.2.10. Company Locations
3.3. Market Structure
3.3.1. Market Leaders
3.3.2. Market Followers
3.3.3. Emerging Players
3.4. Consolidation of the Market
3.4.1. Strategic Initiatives and Developments
3.4.2. Mergers and Acquisitions
3.4.3. Collaborations and Partnerships
3.4.4. Product Launches and Innovations
4. Vegan Food Market: Dynamics
4.1. Vegan Food Market Trends by Region
4.1.1. North America
4.1.2. Europe
4.1.3. Asia Pacific
4.1.4. Middle East and Africa
4.1.5. South America
4.2. Vegan Food Market Drivers
4.3. Vegan Food Market Restraints
4.4. Vegan Food Market Opportunities
4.5. Vegan Food Market Challenges
4.6. PORTER’s Five Forces Analysis
4.6.1. Intensity of the Rivalry
4.6.2. Threat of New Entrants
4.6.3. Bargaining Power of Suppliers
4.6.4. Bargaining Power of Buyers
4.6.5. Threat of Substitutes
4.7. PESTLE Analysis
4.7.1. Political Factors
4.7.2. Economic Factors
4.7.3. Social Factors
4.7.4. Legal Factors
4.7.5. Environmental Factors
4.8. Technological Roadmap
4.9. Value Chain Analysis and Supply Chain Analysis
4.10. Regulatory Landscape
4.10.1. Market Regulation by Region
4.10.1.1. North America
4.10.1.2. Europe
4.10.1.3. Asia Pacific
4.10.1.4. Middle East and Africa
4.10.1.5. South America
4.10.2. Impact of Regulations on Market Dynamics
4.10.3. Government Schemes and Initiatives
4.11. Key Opinion Leaders Analysis for the Vegan Food Industry
5. Vegan Food Market: Global Market Size and Forecast by Segmentation (by Value in USD Million) (2025-2032)
5.1. Vegan Food Market Size and Forecast, by Product (2025-2032)
5.1.1. Dairy Alternative
5.1.2. Meat Substitute
5.1.3. Others
5.2. Vegan Food Market Size and Forecast, by Distribution Channel (2025-2032)
5.2.1. Offline
5.2.2. Online
5.3. Vegan Food Market Size and Forecast, by Region (2025-2032)
5.3.1. North America
5.3.2. Europe
5.3.3. Asia Pacific
5.3.4. Middle East and Africa
5.3.5. South America
6. North America Vegan Food Market Size and Forecast by Segmentation (by Value in USD Million) (2025-2032)
6.1. North America Vegan Food Market Size and Forecast, by Product (2025-2032)
6.1.1. Dairy Alternative
6.1.2. Meat Substitute
6.1.3. Others
6.2. North America Vegan Food Market Size and Forecast, by Distribution Channel (2025-2032)
6.2.1. Offline
6.2.2. Online
6.3. North America Vegan Food Market Size and Forecast, by Country (2025-2032)
6.3.1. United States
6.3.2. Canada
6.3.3. Mexico
7. Europe Vegan Food Market Size and Forecast by Segmentation (by Value in USD Million) (2025-2032)
7.1. Europe Vegan Food Market Size and Forecast, by Product (2025-2032)
7.2. Europe Vegan Food Market Size and Forecast, by Distribution Channel (2025-2032)
7.3. Europe Vegan Food Market Size and Forecast, by Country (2025-2032)
7.3.1. United Kingdom
7.3.2. France
7.3.3. Germany
7.3.4. Italy
7.3.5. Spain
7.3.6. Sweden
7.3.7. Austria
7.3.8. Rest of Europe
8. Asia Pacific Vegan Food Market Size and Forecast by Segmentation (by Value in USD Million) (2025-2032)
8.1. Asia Pacific Vegan Food Market Size and Forecast, by Product (2025-2032)
8.2. Asia Pacific Vegan Food Market Size and Forecast, by Distribution Channel (2025-2032)
8.3. Asia Pacific Vegan Food Market Size and Forecast, by Country (2025-2032)
8.3.1. China
8.3.2. S Korea
8.3.3. Japan
8.3.4. India
8.3.5. Australia
8.3.6. Indonesia
8.3.7. Malaysia
8.3.8. Vietnam
8.3.9. Taiwan
8.3.10. Rest of Asia Pacific
9. Middle East and Africa Vegan Food Market Size and Forecast by Segmentation (by Value in USD Million) (2025-2032)
9.1. Middle East and Africa Vegan Food Market Size and Forecast, by Product (2025-2032)
9.2. Middle East and Africa Vegan Food Market Size and Forecast, by Distribution Channel (2025-2032)
9.3. Middle East and Africa Vegan Food Market Size and Forecast, by Country (2025-2032)
9.3.1. South Africa
9.3.2. GCC
9.3.3. Nigeria
9.3.4. Rest of ME&A
10. South America Vegan Food Market Size and Forecast by Segmentation (by Value in USD Million) (2025-2032)
10.1. South America Vegan Food Market Size and Forecast, by Product (2025-2032)
10.2. South America Vegan Food Market Size and Forecast, by Distribution Channel (2025-2032)
10.3. South America Vegan Food Market Size and Forecast, by Country (2025-2032)
10.3.1. Brazil
10.3.2. Argentina
10.3.3. Rest Of South America
11. Company Profile: Key Players
11.1. Daiya Foods, Inc. (Canada)
11.1.1. Company Overview
11.1.2. Business Portfolio
11.1.2.1. Product Name
11.1.2.2. Product Details (Price, Features, etc)
11.1.3. Financial Overview
11.1.3.1. Total Revenue
11.1.3.2. Segment Revenue
11.1.3.3. Regional Revenue
11.1.4. SWOT Analysis
11.1.5. Strategic Analysis
11.1.6. Recent Developments
11.2. Danone SA, (France)
11.3. Eden Foods, Inc. (Michigan)
11.4. Plamil Foods Ltd. (Folkestone, Kent, England)
11.5. Archer Daniels Midland Company (Chicago)
11.6. Tofutti Brands, Inc. (U.S)
11.7. VBites Foods Limited, (U.K)
11.8. Vitasoy Australia Products Pty Ltd. (Australia)
11.9. Blue diamond growers (Sacramento, CA)
11.10. Earth’s own food company inc. (Canada)
11.11. Hain celestial group, inc. (New York)
11.12. Living harvest foods inc. (U.S)
11.13. Kikkoman corporation (Japan)
11.14. Pascual group (Spain)
11.15. Sunopta inc. (Canada)
12. Key Findings
13. Analyst Recommendations
13.1. Strategic Recommendations
13.2. Future Outlook